
Climate Strategy
Climate change has the potential to impact our businesses, customers and communities. Incorporating climate risks and opportunities into our business strategy is vital to ensuring we continue to be a resilient, thriving business well into the future.
We know that our operations can have potentially negative impacts on nature and biodiversity. The way we use water in our operations can affect the natural environment, as can the generation of rubbish at rest and service areas. Night lighting at toll plazas, and along our roadways, can also interrupt natural biorhythms of local fauna. The existence of our roadways can cause habitat fragmentation, which may affect local flora and fauna.
Defining Climate Scenarios
Atlas Arteria’s climate-related scenario analysis covers both physical and transition risks and opportunities across the entire portfolio. It draws on publicly available information from the Intergovernmental Panel on Climate Change (IPCC) for physical risks and the Network for Greening the Financial System (NGFS) for transitional risks. Additional insights from the International Energy Agency (IEA) are also incorporated in our transition risk assessment.
For physical climate risks, we utilised data from the IPCC’s 2022 Representative Concentration Pathways (RCPs), specifically looking at RCP 2.6 (low emissions) and 8.5 (high emissions). The RCPs describe different levels of GHG concentration trajectories and the associated potential future physical impacts.
Climate modelling was undertaken to support the assessment of physical climate risks, providing insight into possible changes in the local environments of our businesses. Based on data availability and motorway attributes, we explored possible future business impacts arising from key climaterelated variables, including flooding, wind speed, snowstorms, extreme precipitation, landslides and heatwaves. Resulting business impacts considered included increased maintenance and repair costs, reduced revenue (e.g. due to inaccessibility of the motorways or reduced customer use) and increased health and safety risks to customers and employees.
For transition risks, scenario analysis drew on information from the NGFS, utilising the Net Zero (Orderly Transition) and Current Policies (Hot House World) scenarios (see table below). Each scenario presents a different set of considerations, for example on climate policy, emissions and temperature.
NGFS Climate change scenario overview
Early, ambitious action to support the transition to a net zero CO2 emissions economy. This pathway assumes that policies and technological actions are adopted in a co-ordinated and timely manner, refl ecting a policy ambition to limit temperature increase to 1.5°C.

Limited action, resulting in continued global warming and significant increases in exposure to physical risks. This includes a Current Policies Scenario, resulting in potential temperature increases of 3°C+.
Physical climate risk study
In 2024, we undertook a project to help quantify the financial impacts of changes in traffic demand from different physical climate risks at each of our businesses (including ADELAC but excluding APRR and AREA). While there was already anecdotal evidence that certain types of weather can impact traffic levels, the relationship had not previously been reliably quantified for our businesses.
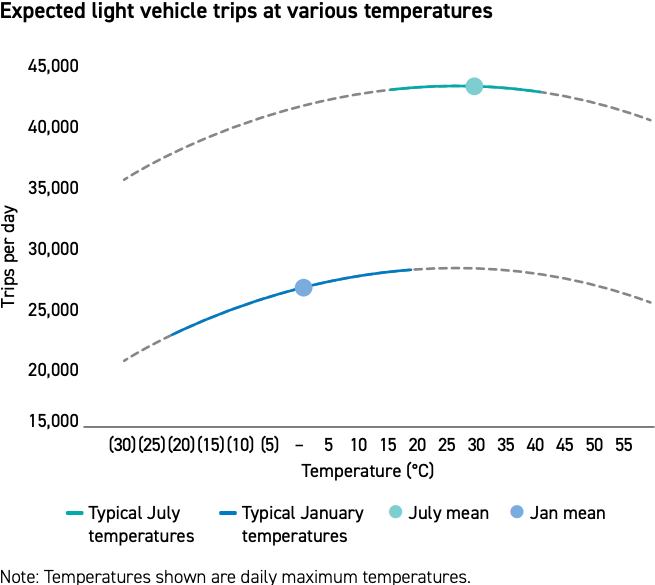
The research confirmed the largest components of weather impacts on traffic come from snowfall and from very hot and very cold temperatures. Other factors such as rainfall, visibility and humidity have minor but predictable impacts. Our businesses in North America have the greatest sensitivity to weather impacts, due to the wide range of temperatures experienced in those cities, particularly in winter.
The figure below shows an example of two temperature/traffic curves modelled for one of our businesses. One curve relates to January (when temperatures can be very cold) and one in July (when temperatures can be very hot). The solid lines show the temperatures that typically occur at each of these times. The dotted lines show the expected change in traffic that would arise should more extreme temperatures be recorded.
Understanding our Climate-related risks and opportunities
Risk and Governance – Key risk table
Physical Risks
- Major flooding impacts on our roads
- More extreme and frequent heatwaves/ extreme heat impacts on our roads
- Health and safety of employees and customers due to climate change
Transition Risks
- Ineffective management of emissions profile
- Emergence of new regulations
Opportunities
- Access to new business and capital due to increased trust and reputation
- Significant cost savings through reductions in energy use and GHG emissions